Posts

Showing posts from August, 2022

Week 34 | 2022 | US Stock Market | is it fading optimism or fear under control?

Image
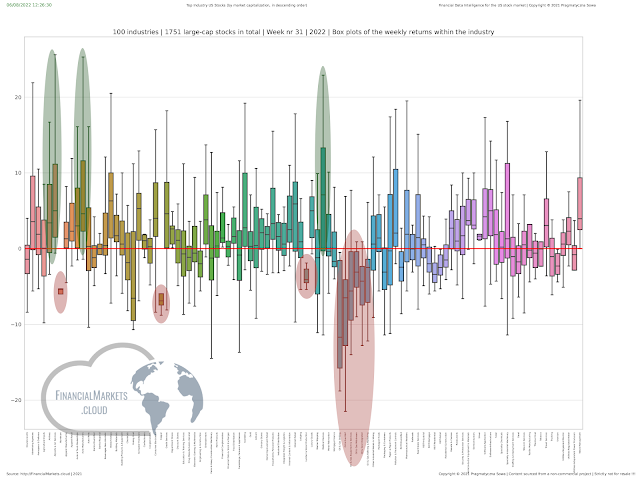
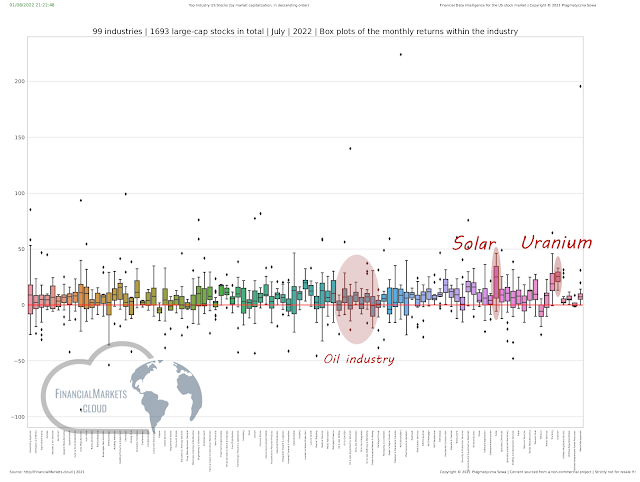
  Commodities (Aluminum, Copper, Silver) and energy (Oil & Uranium) stocks withstood the fading optimism during the entire 34th week of 2022. Market uncertainty | VIX overview | Week 34 All VIX indices were higher and crossed (or touched) their 3 week moving average.  CBOE Gold Volatitity CBOE NASDAQ 100 Volatility CBOE S&P 500 3 Month Volatility CBOE Volatility Index Cboe Russell 2000 Volatility Index STOXX 50 Volatility VSTOXX EUR S&P 500 VIX Futures  Some of them crossed their 12 MA as well:  CBOE Brazil Etf Volatility  CBOE Crude Oil Volatility CBOE Euro Currency Volatility News pick from the last week (collected by RadioSowa.pl) | week 34 https://www.reuters.com/article/usa-economy-housing/u-s-new-home-sales-plunge-in-july-amid-higher-mortgage-rates-idUSL1N2ZY1I5#:~:text=WASHINGTON%20(Reuters)%20%2D%20Sales%20of,Commerce%20Department%20said%20on%20Tuesday. https://www.cnn.com/2022/08/23/homes/new-home-sales-july/index.html https://www.reuters.com/markets/europe/us-pend

Week 32 | 2022 | US Stock Market | optimism everywhere

Image
As seen on the above figure, majority of the large cap-stocks across 100 industries at the end of the week 32 (2022) had positive weekly returns. Only a few industries had a median (a middle horizontal line on each box) of the weekly returns below 0 ( red line ). Moreover there is an ongoing uptrend on the Sol ar stocks which started two weeks ago.  Below animation depicts large-cap stocks behavior in the last 5 weeks (week 28 - 32 2022) on the US Stock Market. As of the week 32, optimism has stabilized, although still one questions remains: for how long?  Market uncertainty | VIX overview | Week 32 All major VIX indices are below theirs 3 & 12 week moving averages (including CBOE Crude Oil Volatility).  News pick from the last week (collected by RadioSowa.pl) | week 32 https://www.reuters.com/markets/europe/sp-500-nasdaq-futures-slip-after-chipmaker-microns-warning-2022-08-09/ https://money.usnews.com/investing/news/articles/2022-08-09/column-u-s-manufacturing-activity-shows-signs

Strong rebound on Solar stocks | Week 32 | 2022 | US Stock Market | early uptrend detection | watchlist

Image
  Two weeks ago FMC system detected unusual volume activity on the Solar industry stocks.   Week 30 | 2022 | Solar stocks | Unusual volume activity spotted on the Solar industry stocks Since then early uptrend has formed. Next weeks will show how long it will last.  In the context of this observation, it is worth mentioning that clean energy stocks (Solar & Uranium) outperformed the dirty energy industry stocks in July 2022.  Portfolio of the solar industry stocks (top large-cap stocks) in the recent 5 weeks earned approx. 30%.  Week 30 2022 brought the strongest gains in this early uptrend detected. Median of the weekly stock returns (solar industry) in the week 29 jumped from 6.75% to 21.25% in the week 30 Currently, Solar is in the Top 10 industries with the highest volatility (based on the Kolejarz scanner output) Kolejarz is familiar with the volatility on the solar stocks from the recent weeks as well.  Solar stocks overview As of the week 32 median and mean of the weekly

Week 31/32 | 2022 | US Stock Market | Dark clouds over Semiconductor industry stocks? | watchlist

Image
According to yesterday's news from Reuters : "Micron Technology Inc (MU.O) slid 3.7% after the memory-chipmaker cut its current-quarter revenue forecast and warned of negative free cash flow in its next quarter as demand wanes for chips in PCs and smartphones Micron's dismal forecast, a day after Nvidia Corp (NVDA.O) warned of weakness in its gaming business, knocked the Philadelphia Semiconductor index (.SOX) down 4.57%, its biggest single-day decline since June 16 as all 30 components fell. The index has lost 7% the past three days." As of the week 31 2022 some of the large-cap stocks from the Semiconductor industry are in the ongoing uptrend.  Portfolios of the Semiconductors & Semiconductor Equipment & Materials also confirms uptrend which started a few weeks back.  FinancialMarkets.cloud News and observations in this article were extrapolated from publicly available data, and subsequently processed by the FinancialMarkets.cloud system powered by Artifi

Week 31 | 2022 | US Stock Market | An overview from a financial data

Image
Week 31 | 2022 | strong gainers Airlines  Airports & Air Services Auto Manufacturers Medical devices Top losers of the week 31 entire Oil industry  Aluminum  Copper Market uncertainty | VIX overview | Week 31 Majority of the VIX indices as the week 31 2022 are respectively below 3 and 12 weeks moving averages .  According to VIX data uncertainty has cooled down.  CBOE Volatility Index  CBOE Gold Volatility  STOXX 50 Volatility VSTOXX EUR  CBOE S&P 500 3 Month Volatility  S&P 500 VIX Futures  CBOE NASDAQ 100 Volatility  Cboe Russell 2000 Volatility Index  DJIA Volatility  Contrary to majority CBOE Crude Oil Volatility rose significantly during the week 31 . Histogram shows its growth in the recent week. Volume activity (Wezuwiusz Project) The highest activity on stocks volume as of the week 31 was recorded on the following industries: Biotechnology Education & Training Services  Medical Devices Paper & Paper Products Textile Manufacturing Volatility (seen by Kolejarz

Dark clouds over Walmart Inc | WMT | Week 31 | 2022 | www.RadioSowa.pl

Image
According to CNBC WMT started to lay off some of the corporate employees yesterday. The company recenlty slashed its profit outlook (for the 2nd Q and the full year as well) due to inflationary consumer behaviour. Other relvant news related to WMT: https://www.fool.com/investing/2022/07/28/should-you-buy-walmart-stock-after-its-latest-anno/   Back in July 2022, WMT was Discount Stores TOP 4 monthly earner just right after  TGT | Target Corporation | NYSE | Monthly return: 12.9 % COST | Costco Wholesale Corporation | NASDAQ | Monthly return: 11.9 % BJ | BJ s Wholesale Club Holdings Inc | NYSE | Monthly return: 8.6 % WMT | Walmart Inc | NYSE | Monthly return: 6.7 %  Overall, Discount Stores top industry stocks portfolio perform relatively poor. listen today's broadcast... http://radiosowa.pl Read more about Radio Sowa project   FinancialMarkets.cloud News and observations in this article were extrapolated from publicly available data, and subsequently processed by the FinancialMar

July | 2022 | the US Stock Market | Clean energy stocks strike back

Image
  Clean energy stocks (Solar & Uranium) outperformed the dirty energy industry stocks in July 2022.  Last week (week 30 | 2022)  the unusual volume activity was seen on thr Solar industry stocks Both Solar and Uranium industries had the highest median of the monthly stocks returns out of 100 US stocks industries. All Uranium stocks earned on average 24% in July 2022, where some monthly returns within Solar industry reached 40%+.  Solar and Uranium stocks portfolio seen as of week 30 2022. FinancialMarkets.cloud News and observations in this article were extrapolated from publicly available data, and subsequently processed by the FinancialMarkets.cloud system powered by Artificial Intelligence. *** Disclaimer Please note that the content of this article is not an investment advice. Please do your own research, and ideally backtest before trade. Before making any financial decisions, always consult with a registered investment advisor. *** Content does not express any personal aut

Week 30 | 2022 | Solar stocks | Unusual volume activity spotted on the Solar industry stocks

Image
As of the week 30 2022, unusual volume activity on the Solar industry stocks was detected by the  FMC system.  News and observations in this article were extrapolated from publicly available data, and subsequently processed by the FinancialMarkets.cloud system powered by Artificial Intelligence. *** Disclaimer Please note that the content of this article is not an investment advice. Please do your own research, and ideally backtest before trade. Before making any financial decisions, always consult with a registered investment advisor. *** Content does not express any personal author's (nor data owners) views or opinions. It depicts just observations extrapolated from data. Cannot guarantee that presented evaluation is free from logical or statistical error. Please do your own evaluation. *** FinancialMarkets.cloud   is a non-academic research that receives no-external funding.  *** All rights reserved Copyright © 2018 - 2022 PragmatycznaSowa www.PragmatycznaSowa.pl www.Pragmati