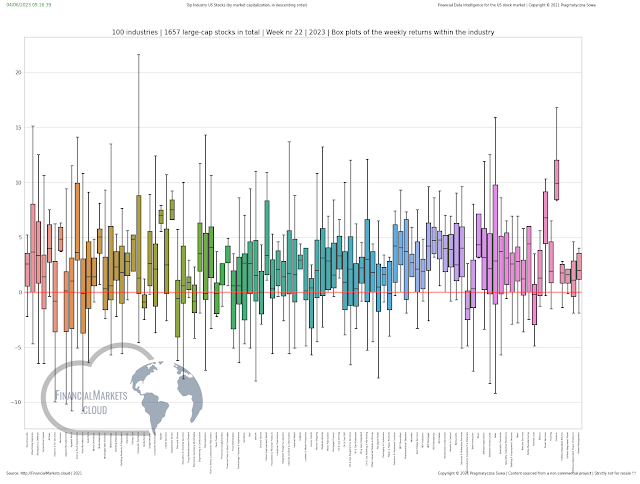
Uranium Stocks went wild | Week 22 | 2023
Strong rebound on Uranium industry stocks took place on last Thursday (01.06.2023) week 22. It looks like it was the strongest positive reaction on the debt ceiling deal across 100 industry stocks (5th boxplot from right)
On every (uranium) daily stock chart we do see a volume spike combined with an 'unusual volatility' patterns. For instance something that might be interpreted as (Larry) Williams's "Reversal day pattern" or (Joe) DiNapoli's Railroad Track (RRT) seen on LEU daily chart.
LEU | Centrus Energy Corp | NYSE
CCJ | Cameco Corporation | NYSE
NXE | NexGen Energy Ltd | NYSE
'Kolejarz scanner' sees a lot of volatility on Uranium Stocks this week.
Volume % changes detected on Uranium stocks this week were highest among all analyzed stock industries on the US Stock Market.
On the Portfolio Performance chart this week's rebound is marked explicitly.
This week Uranium stocks are on the 6th place with the highest positive news sentiment and almost no negative news.
Data sources:
EOD Data| https://eodhistoricaldata.com/
Data Analytics sources:
Cloud analytics | US Stocks FinancialMarkets.cloud
Skaner ponad-przecięntej zmienności rynkowej: Skaner Kolejarz
Suggested citation:
Uranium Stocks went wild | Week 22 | 2023
https://www.financialdata.news/2023/06/series-of-anomalies-net-positions-oi.html
Written by 'Kolejarz' from the MarketGeeks.pl team.
------------------------------------------------------------------------------------------------------------------------------------------------------
***
Disclaimer
Please note that the content of this article is not an investment advice.
Please do your own research, and ideally backtest before trade.
Before making any financial decisions, always consult with a registered investment advisor.
***
Content depicts only observations extrapolated from data. Cannot guarantee that the presented evaluation is free from logical or statistical error.
Please do your own evaluation.
***
Treści prezentowane w tym artykule mają charakter wyłącznie edukacyjny i tylko tak należy je rozumieć.
Są to prywatne opinie autora, i żadnym stopniu, części lub całości nie stanowią rekomendacji inwestycyjnych w rozumieniu Rozporządzenia Ministra Finansów z dnia 19 października 2005 roku w sprawie informacji stanowiących rekomendacje dotyczące instrumentów finansowych, ich emitentów lub wystawców (Dz. U. z 2005 roku, Nr 206, poz. 1715)
Autor nie ponosi odpowiedzialności za decyzje inwestycyjne podjęte na podstawie przedstawionych tu treści, ani za straty, które mogły one spowodować. Prezentowanych treści nie należy również rozumieć jako zachęty do inwestowania czy spekulacji finansowej.
***
All rights reserved
Copyright © 2018 - 2023 Financial Data News
www.financialdata.news
Wykorzystywanie treści powyższego art. w części lub całośći jest zabronione i wymaga pisemnej zgody autora
Kontakt z redakcją


Comments
Post a Comment